Friday 12 October 2018

London St. Thomas Third Quarter Market Update 2018


Our Trading Area:

The Real Estate Market is still “Hot” with prices rising and low inventories across our trading area. Sales on a year-to-date basis are still below last year’s record of 28,831 sales for the area by -19.5%. We started 2018 with sales running 30% below 2017. That gap has narrowed by a strong 3rd quarter. July was 97.3% of last year. August was 101.2% of last year and September hit 89.8% of last year. The average price of a Home in our trading area moved up the first 9 months of 2018 by 8.1% over the first nine months of 2017 and now sits at $395,197 for a home in our trading area. It was at $365,592 as of last September based on a rolling year average.

City of London:

The number of homes sold this year in the City of London itself are now only off -18.5%. Remember we started over 30% below last year’s record year. We have explained previously that a balanced market (good supply and good demand) is 6 months supply. We hit 4 months’ supply in July then dropped to 3 months for August and September. This puts significant upward pressure on prices. This year the City of London delivered Home Owners an average minimum of 100% of their list price, every single month of this year, because of this limited supply market. It is currently at this level. This is a quieter time of year but still very active. The number of days that it took to sell the average home in London moved between 23 and 24 days for July, August and September and now sits at 23 days,

As you can see on the graph above, selling price of homes in the City have risen nicely. Last year at this time the Average Selling Price of a Home in London reached $337,681. Home Owners will be pleased to know that this year the Average Selling Price is up above my projection and sits up 10.2% or $34,393 of the first 9 months of 2018. September as you can see by the Graph above hit $400,000.
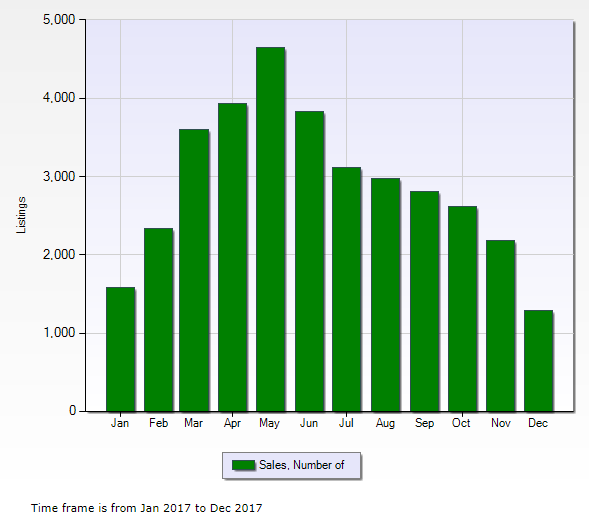
Buyers coming into or Living in London don’t like paying more than $600,000 for premium homes. The number of homes sold this year priced between $600K to $700K is about 40% lower than homes prices between $500K and 600K. Here is a graph that illustrated activity by price this year. Remember this is the top end of our market.

London North:

Sales in London North are now only down -20.2% on a year to date basis over last year’s record. This is a little more than the City shortfall. Don’t forget this area has the highest average price. Once again, the number of Home sold in the 3rd Quarter have been much closer to 2017 3rd Quarter results and are down only -7.6%. Inventories are low, running at 4 months supply of homes for sale in September up from 3 months supply in August. It took 29 days to sell a home in September, up marginally from 26 days in July and August. What does all this mean? Well, its
still very much a Seller’s Market based on demand and the number of homes coming to market that are offered for sale. Home Owners are consistently getting 100% of asking price.


As you can see by the graph above, London North has the highest average selling prices in the City. The Average Home Selling Price last year reached $410,594 in North London. This year prices for the first 9 months have reached +10.5% or a gain of $43,150 for an average Home. The new Average Selling price in North London is now $453,744. One other interesting number to share with you. In September the average selling price based on only 171 homes sales reached an average of $486,640. See my comments on the London Buyer $600,000 maximum price barrier. Pricing a home at $599,900 has brought about multiple bidding wars. As time passes the acceptance of homes priced between $600,000 and $700,000 will become more normal.

Remember when Buying, or Selling, look at comparable homes. Your decision to Sell, or to Buy, will be based on a realistic price.

We must stress again, that we believe this upward price trend will continue but should slow next year to more normal annual increases. We recommend that Buyers “MOVING UP” or “FIRST TIME BUYER”. Do it right now! Sellers that want to “DOWNSIZE” Don’t Do It Now! You are throwing away equity, unless you must. Remember that there are always Equity Mortgage’s available…

London South:

Sales in London South due to moderate price range have performed better than the North on a year-to-date basis. The decline over last year’s record Sales of Homes is only -18.4%. The number of Home offered for sale now sits at 4 months of supply. This is up marginally over August 2018 at 3 months supply. The average days to sell, because of the slower time of year, has been running between 22 and 23 days for July and August and then back down to 22 days for September. Because of this limited supply of homes for sale, the average Home Owner in
the South end of the City of London is still getting 100% or better of their asking price. The average has been holding at 100% for the last 3 months. What does all this mean?
.
Sale prices for Homes in South London are now up 9.0% over the first 9 months of 2017. This represents an average increase in value and equity of $31,391. The average Home in South London now sells for $368,910.00 up from $338,516 in September last year, based again on nine months of sales of homes. As you can see things are still moving up…$371,143 in August and $401,524 (based only on an average of about 200 homes a month in South London). We must stress again that we believe this upward price trend will continue but should slow next year to more normal annual increases. We recommend that Buyers “MOVING UP” or “FIRST TIME BUYER”. Do it right now! Sellers that want to “DOWNSIZE” Don’t Do It Now! You are throwing away equity, unless you must. Remember that there are always Equity Mortgage’s available…

London East :

Sales in London East due to lowest average price range in the City have performed better than the rest on a year-to-date basis. The decline over last year’s record Sales of Homes is only -16.6%. The number of homes in this area available for sale sits at an average of only 3 months supply up marginally from August when it dipped to 2 months only. This limited supply of Homes offered for sale has dropped the average number of days to sell a Home from 22 days in July up to 23 days in August down to only 18 days in September. London East, having the most economical tradition pricing for the City of London, delivered the Average Home Owner 100% of asking in July and August and rose to 101.5% in September because of the very limited supply of homes offer for sale.


In 2017, the average home price is East London sat at $254,630 on a year to date basis to September 30. Prices have now risen across the East by a whopping 13.2% or +$33,575. This Area continues to be an affordable area for First Time Buyers to get into this crazy Market. The rules here are the same as the rest of the City. If you are a Buyers “MOVING UP” or “FIRST TIME BUYER”. Do it right now! Sellers that want to “DOWNSIZE” Don’t Do It Now! You are throwing away equity, unless you must. Remember that there are always Equity Mortgage’s available…Nobody should be paying a Landlord, if they can afford to buy! You just lose money. Look at Toronto and the other major centers of the world… Most people trying to enter those Markets can’t afford to do it. Once you are a Home Owner, you are able maintain your equity build position.

St.Thomas:

I have been stating for some time that I believe St. Thomas is an opportunity Market. It is apparent that Buyers are picking up on the bargains in this Bedroom Community of City of London. We have stated that the year-to-date performance for our trading area sits down at -19.5% when compared to last year’s record sales of Homes. St. Thomas is only down 13.8% against last year’s number of homes sold over 9 months. In the last 2 months St. Thomas Home Sales have been above last year for the same period. The number of homes offered for sale has consistently sat at 3 months average supply, per month, since June. The number of days to sell a home in this area reached 25 days on average in September. Clearly this continues to be a Seller’s market with a price advantage. Home owners have been getting 100% of asking price every month since January.


Believe it or not, the average Home in the City of St. Thomas for the first 9 months of 2018 still sits below $300,000. At the end of September after 9 months in 2017, a record year, the average price reached $255,436. In 2018 the average price in this area rose +16.4% or $41,816.00. This represents the highest gain in value in the area and based on an average price of less than $300,000, this drive upward is likely to continue. The Selling or Buying rules here are more applicable than ever! If you are a Buyers “MOVING UP” or “FIRST TIME BUYER”. Do it right now! Sellers that want to “DOWNSIZE” Don’t Do It Now! You are throwing away equity, unless you must. Remember that there are always Equity Mortgage’s available…Nobody should be paying a Landlord, if they can afford to buy! You just lose money. Look at Toronto and the other major centers of the world… Most people trying to enter those Markets can’t afford to do it. Once you are a Home Owner, you are able maintain your equity build position.

Summary:

We are here to “Help”, You, Your Family, Your Neighbours, Your Co-Workers and Your Friends! Any time to Buy or Sell, is a good time in this “Hot Market”! Why? If you are paying rent the Housing Market is leaving you behind. Any home ownership is keeping pace for your ability to move up as you build equity too. It is also a good time to move up, let’s say the difference is value of your Home to the Home you want to Buy is $75,000. Doing it now, may put $5000 to $7500 future equity in your pocket, if the Market moves anther 6% to 10 %. This is not a time to procrastinate. An average of 2,327 home sell every month across our trading area in 2018.


If we are running close to last year’s sales of homes now, we should Buy and Sell close to 6000 homes between October and December. Based on the price trends in the last few months we will see additional price gains.

If you are thinking of liquidating or downsizing, “DON’T DO IT NOW “, unless you have to.

CALL TODAY:

Gib Heggtviet                          Mary Heggtveit
Real Estate Broker                   Sales Representative
Direct: 519-535-3975              Direct: 519-535-7355
                    
 Gib@YourFavouriteRealtors.com 
Mary@YourFavouriteRealtors.com

Prices Don’t stay Down EVER! Look at the average prices for 2008 when World recession hit and 2009 when we started recovery in back half.


Don’t “Wish You Did”
Call Now: 519-421-2626

Thursday 2 August 2018

Your 6 Month Market Update for London, St. Thomas and Area - 2018

London St. Thomas & Area Overview:
The number of homes sold over the last six months is lower that last year (a record year) by 26.5%. The number of homes offered for sale started the year with slightly over 5 months’ supply of homes and then dropped in March to an average of 4 months.  Remember a balanced market is 6 months’ supply of homes for sale.  Since the end of April, the number of homes offered for sale have increased marginally and now sit at 5 months’ supply. This will improve Buyer’s ability to negotiate in some price categories. Home Owners are now getting an average of 99% of their asking prices. This indicated that many price categories and areas are in bidding wars. Prices across our trading area are up nicely by 5.9% over last year’s record price increases. The average home across the county is now worth $385,586 which is an increase of $21,601 for the first 6 months of 2018.  If supply of homes continues to increase, we may experience some leveling in price increases.  In my last report the number of homes available was lower and we were heavily into bidding wars. This activity has cooled somewhat because of the continued increase in available properties. Prices won’t likely fall as we are still seeing an influx of Toronto Buyers cashing in on their leveling market.  Based on this activity we can expect an increase of about 6% to 8% for the year over 2017.

London:
The number of sold homes within the City of London is also reflecting a downturn, driven by sales with limited supply (less than 6 months inventory of homes for sale).  The number of homes sold is off 24.3% versus last year’s record number of homes sold.  Prices on the other hand are still rising, the average home now sits up nicely by 8.4% or $29,000 bring the average home to $370.435. 


Inventories are low in London sitting at only 3-month average until June when they rose marginally to 4 months. This low availability is what is driving the prices up across our trading area. Home owners are getting an average of 101.8% of their asking prices…Homes priced from $100,000 to $800,000 are all selling at over 100% of asking price.  If this market continues with tight supply, significant demand will continue to push prices upward.  Inventory levels are obviously the key. First Time Buyers and Move Up Buyers need to get in now to benefit from continued equity growth in the back half of this year and in the years to come and from our low mortgage rates.  This is obviously not the time to downsize unless you need to do it.


London North:
The number of homes that sold in the first 6 months is down by 26.2% versus the first six months of last year’s record year. The number of homes offered for sale has gone as low as only 2 months’ supply in March, then 3 months in April up to 4 months for May and June. This lower availability that is lower than the overall City has translated into constant bidding for homes in London North in virtually every selling situation, getting sellers an average of 101.8% of asking. In addition, limited supply like this can limit overall sales and leave unsuccessful buyers frustrated.

So, how are prices?  Remember that North London already has the highest average price. This year, this area has risen again by 7.8% in the last 6 months, or $32,310, to an average selling price of $444,863. 


This aggressiveness should continue if inventories remain well below 6 months’ supply and should deliver an average price between 8% and 10% by year end.  Right now it takes between 15 days and 21 days to put an average home up for sale and get it sold.

Once again, the bidding wars in this area are reinforcing that London North continues to be the most desirable area of London.  The area offers so many conveniences, great schools and the home of University of Western Ontario.


London South
The number of homes that have sold is now down 23% over the same sales period of 2017. This is actually a return to more normal levels. This area is also still very much in a Seller’s market with only 3 to 4 months’ supply of home to sell, based on demand and inventories.  This demand will continue to push prices up. Home owners are consistently getting over asking price.  They are getting on average 102.6% of their asking price. So, what has all this done to the average selling price? 


Prices are up in line with the North at 7.1% or $24,340 bring the average home price up to $366,562. The number days it takes to sell a home in this area has been steadily dropping to where it sits at just 18 days on average at the end of June and dropping.

London East:
The number of homes sold in London East have fallen by 23.8% versus last years record sales as well.  But, there is plenty of good news here. Inventories are well below the 6-month average required for a balanced market. The number of homes offered for sale dropped under 3 months’ supply in February and March and have increased since then to about 3.5 Months.  Because of these significantly lower levels of homes offered for sale, these home owners are consistently getting well over asking prices.  The average for the first six months sits at 102% of asking price.  It now takes 20 days in this area to sell a home.
  
What has this low availability of home for sale done to prices?


Prices in this area are breaking records…Prices are up a whopping 13.2%.  This represents an increase of $33,700 on average bring homes in this area to a new base price of $288,602.  The East is beginning to move.  What an opportunity for First Time Buyers to get into the Market.
  
St. Thomas:
In my opinion St. Thomas continues to be one of the best priced areas of Southwestern Ontario.  It is really a Bedroom Community of London and had all key services including bus services.  The fact that Ford is no longer in Tabotville has little relevance.  St. Thomas is also near Port Stanley, a wonderful summertime destination for food, entertainment and beaches.   The average price of a home in St. Thomas is still lower than Ingersoll currently at $322,838 with much less services and infrastructure. I believe people are beginning to get the message!

Sales this year have returned to normal levels like all other areas, but off only 20.1%. The number of homes offered for sale here compared to demand has been consistently lower than all other areas.  St. Thomas has had an average of only 3 months supply for 5 months in a row.  It takes an average of about 20 days to sell a home in this area.  This limited number of available homes is pushing up prices like the other areas. Home owners have been getting around 101% of their asking price. Again, experiencing multiple bids.

What has happened to prices?


Selling prices for the first six months of 2018 are up a record of 15.2% in this area! Wow St. Thomas is leading the price growth in the area!  This means the average home increased in value $38,307 since January bringing the average home to $290,821.  Still a bargain in any market in Southwestern Ontario.

Summary:
What does all this mean. The market is buoyant and will finish with a strong finish once again. Interest rates are still at record lows. Remember demand is the key. 

Example: If you are a Toronto Area resident about to retire or kids have left for University, or you work from home and are sitting on a home worth even $800,000 and you have a low mortgage… What would you do… Move to Southwestern Ontario! Buy a beautiful dream home for even $600,000 and put close to $200,000 into the bank for a rainy day! That is what is going to continue to drive this market.

I love to point out when the average price in 2004 in Mississauga was $240,000 and London and area were at $200,000.  Logically, which market will experience potential correction, I doubt it will be London and area!

There is no better time to buy your first home, make a lateral move or move up!  If you are thinking of downsizing, wait until the market comes back into balance.

Please share this update with anyone who will benefit…and …. Remember, Mary and I are here to help you, your family, your friends, your co-workers. Call us with their names, timing, phones and email and we’ll get to work saving them money. There are differences between realtors. We are proud of our results and our Friendships with our many Clients.

Gib Heggtveit                           Mary Heggtveit
Broker                                                               Sales Representative         
RE/MAX Centre City Realty Inc                        RE/MAX Centre City Realty Inc

Cell: 519-535-3975                  Cell: 51-535-7355              
Gib@YourFavouriteRealtors.com                         Mary@YourFavouriteRealtors.com

Tuesday 16 January 2018

Full Year Market Activity Results for 2017 for London/St.Thomas Trading Area

CITY OF LONDON:
Well, what a year! This was clearly a record setting year for my 15 years of Real Estate experience. Our City experienced a value increase for the average home of 18.3% in one year. The average home rose from $283,510 to $335,607. This new record sale price was driven by an 11.6% increase in the number of homes sold versus 2016. What contributed to these records? Based on statistics it appears that inventories dropped signicantly in 2017 and Buyers from Metro Toronto started capitalizing on their equity across central Ontario.


For statistical purposes it is important to understand what a balanced market is.  A balanced market has 6 months’ supply of homes for sale. A Buyers’ market offers more than 6 months’ supply while an Sellers’ market offers less. inventory in January 2016 sat at 1168 homes (4 months’ supply) for sale and then dropped to 721 homes (2 months’ supply) for sale in January 2017. This represented a 38.3% decrease in supply starting the year. These set things on fire. Over the year it took an average of only 23 days to sell a home.  In December last year this rose to only 35 days.  Home owners received 100% of asking in 2017 versus 98.3% of asking in 2016. This month we are averaging 99.4% of asking (based on 80 sales to January 15, 2018).  We are starting the year with only 3 months’ supply. This means the pressure on “Supply versus Demand” will continue.  When we add in the continued projected interest rate offered below 4% on Mortgage Rates (assuming the Feds increase interest rates next week (even ½%) and continued demand from Metropolitan Toronto cashing in on equity. We can anticipate at least a 5% increase across the city in the year ahead unless inventory of homes increase dramatically. Fewer choices equals higher prices!

LONDON NORTH:
The number of homes that sold in North London rose only 4.4%, based on limited supply for most of the prime selling season. The number of average days it took to sell a home in 2017 was 21. In 2016 it was significantly higher at 34 days. This severely limited inventory drove the average price of a home in North London beating the London average, up 18.1%, up from $345,113 to $407,397 ($62,287). Many home owners enjoyed competing offers. This delivered an overall list price to selling price ratio of 101.1% (up from 98.7% in 2016). Let’s look at supply, we started 2017 with only 2 months’ supply of homes for sale.  By December we sat at 4 months’ supply based on time of year heading into January 2018. Inventory in December 2016 sat at 216 homes.  In December 2017 we finished with 283 homes available for sale.  This is still well below a balanced market.  This would indicate that supply will not pace demand in 2018 resulting good price increases estimated to be above 5% for 2018.  The influence of Toronto Buyers with deep pockets of equity, and continued bargain Mortgage rates bringing First Time Buyers and Move Up Buyers to market, will easily bring these projections to reality.

SOUTH LONDON:
This area like North London started the year with only 2 Months’ supply of homes offered for sale. This limited number of homes available ended 2017 delivering the second highest increase for all areas of the city of London with a 13.2% increase.  This increase drove prices up 17.6% or an average of $56,900. The average house price now sits at $380,000 in the South. Homeowners in this area in 2016 received 97.1% over the calendar year. Last year with this higher increase in demand the difference between listing price and selling price tightened to 98.2%. For the month of January to January 15, 2018, homeowners are getting a healthy 97.7%.   Inventories are a bit higher in South London coming into the new year.  In December inventory hit 4 months’ supply or 488 homes offered for sale.  In December 2016 the carry-over was only 2 months’ supply or 255 homes offered for sale.  The fact that there are more homes to choose from should allow a bit if negotiation on listing price. However, 4 months’ supply is, by definition a Sellers’ Market.  We will see continued price increases. With North London continuing to have limited inventory supply, this will definitely drive prices and activity in London South.

EAST LONDON:
This area of the city has always had the best bang for your home dollar with the lowest average prices in the city.  In 2017 East London delivered the highest increase in homes sold at 18.2% over the previous 12 months. This outstanding result in the number of homes also delivered the highest percentage increase in home values. The average price rose 18.1% or $38,675 and now sits at $252,820 in this area. Home owners were able to get 100% of their asking price in 2017 up from 97.7% during the previous year. The time it took to sell a home dropped from 32 days in 2016 to 24 days in the heated market of 2017. In December 2016 inventory sat at 2 months’ supply of homes for sale, 186 homes listed.  This was a major contributing factor to high demand and increases in prices for this area.  In December 2017 inventories of homes available for sale increased to 3 months’ supply or 266 homes available.  Once again inventories are tight with only 3 months to start things off.  All indicators are that prices will do well in this area of the city again…Should see leading sales volume and price gains driven by the lower average prices in this area.

ST.THOMAS:
In our opinion this trading area offers the best current value for a Home Buyer.  We look at ST. Thomas as a “Bedroom Community” for London. Ideally located south of London and the 401 and just north of the Summer destination of Port Stanley with its beaches, restaurants and bars, St. Thomas has greater infrastructure than Ingersoll Ontario, yet is better located and offers lower average selling prices. That being said, sales in the city increased an average of 8% for 2017. City wide inventory of homes for sale carried over to this area as well, finishing 2016 with only 2 months’ supply available. This limited supply resulted in the average homeowner getting 99.2% of asking price versus 98.1% a year earlier. This would indicate many homes enjoyed competing offers at peak market time. The result, was a 15% increase, or + $33,959, to an average price of $259,983 for 2017. The number of days it takes to sell a home also dropped from 41 days to 27 days.  Inventories of homes offered for sale in December 2016 had dropped to 2 months’ supply. At the end of 2017 the number of homes for sale increased to 3 months’ supply (105 active listings) . This is still lower than the 4 months’ supply (135 active listings) for start of 2016.  This also still positions this area as a Sellers’ Market. Once again we anticipate +5% growth for the area. Sellers are already getting 98.5% of asking above the average for 2016.

SUMMARY:
What to do?

Don’t need to move or upgrade?   Don’t sell! The average Home will enjoy a good increase in value again in 2018.  

However, If you are a First Time Buyer or a Move Up Buyer, TODAY is the best date and time to get moving. BUY! Why?  Interest Rates on Mortgages are still lower today (less than 4%) than they will be by year end. Each payment is going to reduce your mortgage on “your” home and not into your landlord’s pocket.

With prices rising, Move Up Buyer will make somewhere better that 5% on every new dollar that they invest in a bigger home.  That’s +$500 on every $10,000 investment in 12 months. Going from a $400,000 home to a $500,000 home, theyll make +$5,000. Payments will increase, less than +$500 a month.  Where else can you build for the future with tax free dollars like this?

CALL:
Gib Heggtveit or Mary Heggtveit
Broker & Sales Representative
RE/MAX Centre City Realty inc.

Home Office:      519-421-1991

Email:                   gib@yourfavouriterealtors.com